OpenCTI #7 - Advanced Features
Discover OpenCTI in this series. This 7th episode will go through advanced features you can use in OpenCTI's GUI.

In the last post, we saw how to do investigations and how to share data. This post will discuss advanced features of OpenCTI.
Advanced filtering
Since version 5.12, OpenCTI revamped its filtering features and now allows to build advanced queries to allow fetching data either for search purposes, bulk edit or export.
Fields available for filtering will depend on which pane you are on. For my example, I will be on the Data -> Entities pane.
It is now possible to perform advanced queries by combining operands using the AND and OR operators. At each step, OpenCTI will suggest you terms for your search.
To add a filter, use the "Add filter" dropdown. Beware to not accidentally clear your filters by clicking on the button located at the right of the "Add filter" dropdown.
Filter elements are built around filter terms, aka the fields and values you want to search, and nested filters that will contain subterms. This is how you can have precedence between filters. For example object types Tool and Malware that are related to a given report:
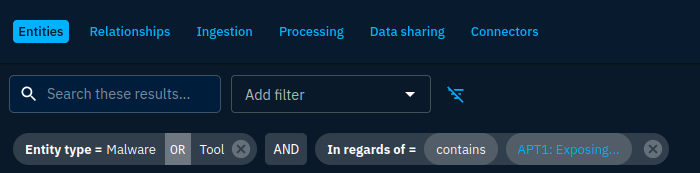
Note that in this case, the OR operator takes precedence over the AND operator. The search results will contain both Tool and Malware objects related to the report.
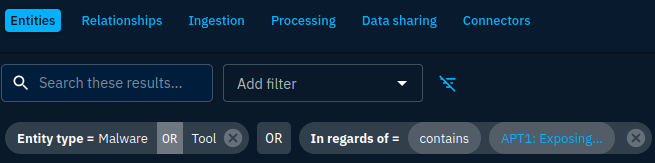
We can switch operators by clicking on them:
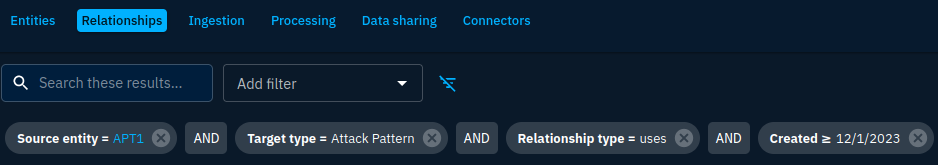
If we go to the relationship tab, we can also examine relationships themselves.
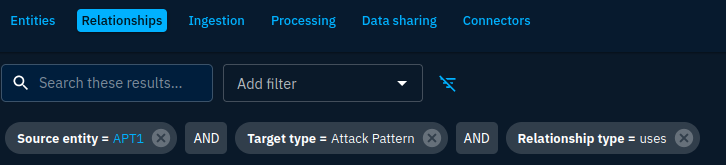
You can also use different comparison operators (Equals, Not Equals, Greater than, Less than, etc...):
Understanding filters is necessary to use most of OpenCTI's advanced features. Filters are used notably in bulk operations, notifications, dashboards, data feeds, etc. You will want to spend some time on them to understand what are the possibilities.
Bulk operations
We saw that editing data in OpenCTI can be time consuming, especially if we have to repeat the same operation several times.
OpenCTI allows to perform bulk operations without having to use the API directly. Bulk operations can be performed in nearly any panel that lists objects and can be the following:
- Replace: replace the value of a field in bulk
- Add: add a value to a field in bulk
- Remove/Delete: delete an object or a value in bulk
- Merge data that corresponds to the same object
- Add to a container: add to a report, a grouping or a case in bulk
Depending of the type of list you can also do the following in bulk:
- Rule rescan: force the rule engine to rescan the objects
- Enrich: run an enrichment connector in bulk
- Observable/Indicator creation: create indicators based on observables and the other way around
Note that modification actions (replace/add/remove) are limited to a subset of fields. For example, it is not possible (at least at the time of writing) to bulk edit a valid_until field for indicators.
To perform bulk actions, you will likely need to filter the list first to select objects to change. You can do that the way we explained in the last section.
Once you are happy with your filter, select one, several or all the objects by clicking on the right checkbox. A new toolbar will appear at the bottom of the screen. This is the bulk operation toolbar.

The most common tool is the edit (the brush at the left) tool. This will allow you to change data in the selected entities:
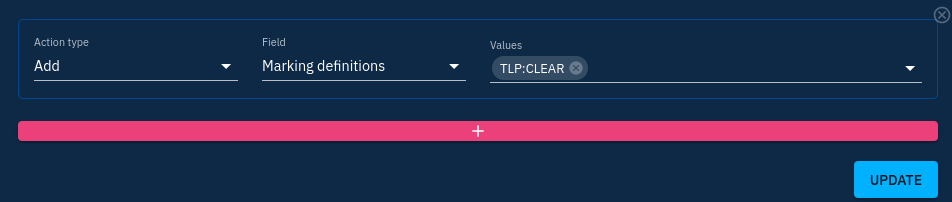
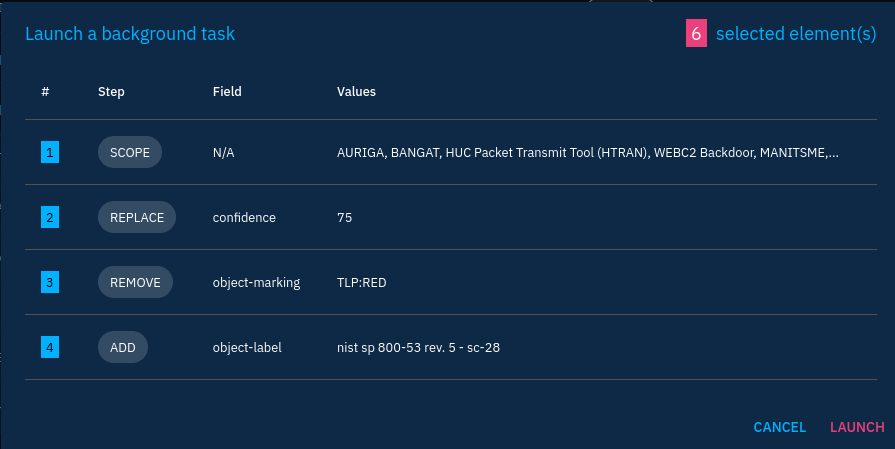
You can combine several changes by clicking on the + button. Once you are happy with the changes, you can apply them by clicking on the update button. A final review will be displayed, make sure your modifications and filters are right as you can modify many elements in one operation:
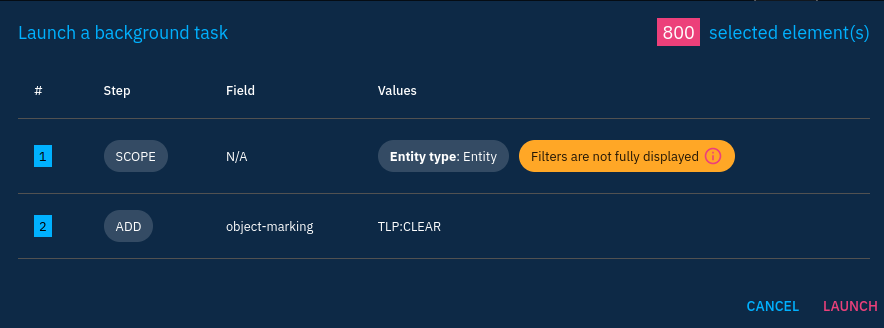
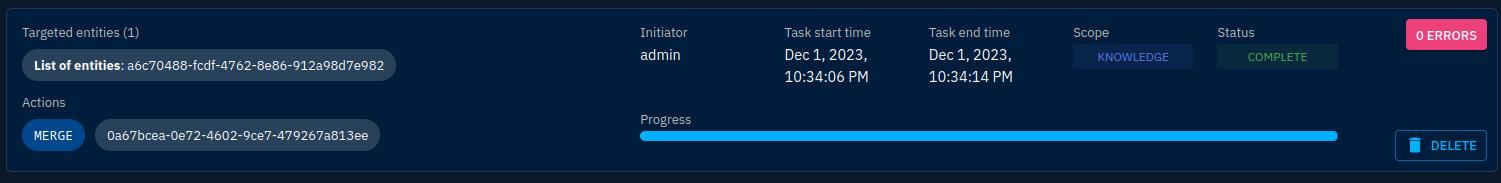
Bulk operations are launched as background tasks. Thus, you will not see changes instantly. To check the progress of the task, head to the Data -> Processing -> Tasks pane:
Even if the bulk operations feature of OpenCTI is a powerful tool allowing to gain some time, it is rather limited in terms of fields it can bulk edit. This could be improved in the future but you will see in the next post that some actions still need some API use to be able to do bulk operations.
Notifications
OpenCTI allows to define notification rules that will trigger when objects matching the provided filters are created, changed or deleted.
Notification rules can be defined at 2 levels:
- User level: when the user sets the notifications for themselves
- Settings level: the administrator can define rules for groups
Notifications are an important part to maintain consistency of the data in the platform, especially when connectors are running. They allow to watch changes made to the intelligence corpus and to improve analyst response time.
Creation of such rules is similar in both the user and settings level. We'll only cover the user level that can be generalized to the settings.
To get to the notification settings, click on the bell icon at the top right of OpenCTI's screen. Then go to the "Triggers and digests" tab.
When creating a new rule, you will have the choice between Live Trigger and Regular Digest:
- A Live Trigger is a rule that will fire a notification immediately when the filter gets a match
- A Regular Digest is composed of one or several triggers and compiles the objects matched in a unique digest. It is fired at the schedule defined by its creator
As we need Live Triggers to create Regular Digest, let's start by describing Live Triggers.
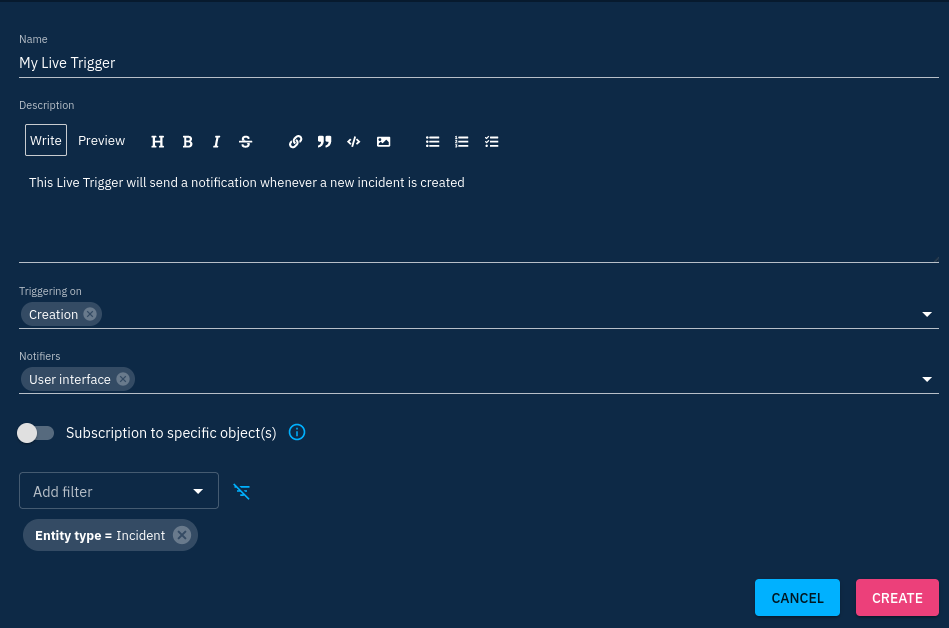
A Live Trigger will have metadata such as a name and a description. Be clear and concise to keep track of your triggers efficiently.
You have the choice to define what kind of event will trigger the notification: Creation, Change or Deletion. You can combine any of them.
You can also subscribe to a specific object, notably to monitor changes related to a specific event. In this case, you will obviously only be able to monitor changes and deletions.
You will also have to choose the notifiers to use to carry the notification. Some connectors allow to add notifiers but you will likely have the User interface and the Default mailer notifiers. These are self-explanatory, the latter will only work if you configured your platform to send e-mails.
In the event where you do not define any notifier, the trigger rule will not generate any notification. This can be leveraged to create digests based on trigger rules you don't want to generate notifications by themselves.
A digest will provide notifications grouping several events at regular intervals. For example, this is useful if you want to get a notification for batch of new reports ingested in the platform at a specific time:
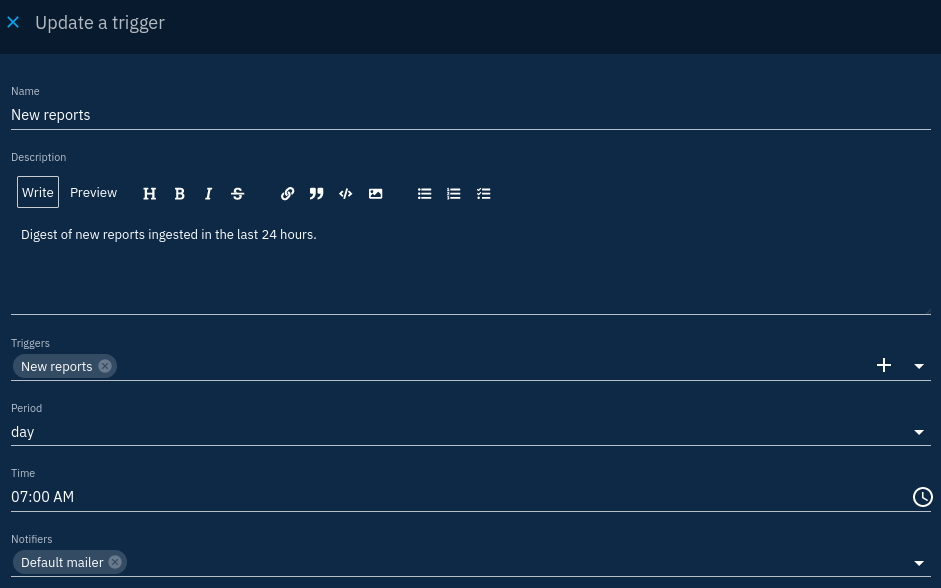
A digest is defined by its frequency, the unitary triggers used and the notifiers used.
If one or several triggers of the New report trigger occur, the corresponding objects will be added to the digest. Else, if the trigger doesn't occur during the 24h period, no notification will be sent by the digest.
Digests are a great way to send notifications that contain the backlog for analysts.
If a trigger or a digest is configured to use the User interface notifier, a red dot will appear beside the bell and a notification will be listed in the corresponding pane:
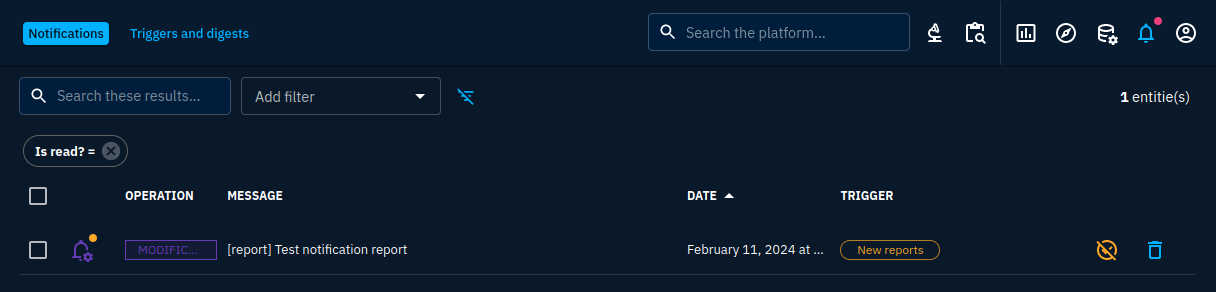
Clicking on the name of the notification or digest will take you to the corresponding objects. To mark it as read, you have to explicitly use the mark as read button located at the right of the line.
Dashboards
When you authenticate to OpenCTI, a default dashboard is displayed. But you can define more using the dashboard pane. You access it by clicking the chart button at the top-right of the OpenCTI screen.
Create a new dashboard using the "+" button. Since version 5.12, you can import a dashboard in JSON format as well as individuals widgets. As this is a recent evolution, there is not much available at the moment.
In the meantime, you can create dashboard yourself.
Dashboards are matrix that allow you add widgets that will contain the actual charts. You can organize these by drag-and-dropping them on the grid.
To add a widget, click on the "+" button of the pane opened after creating you dashboard and opening it.
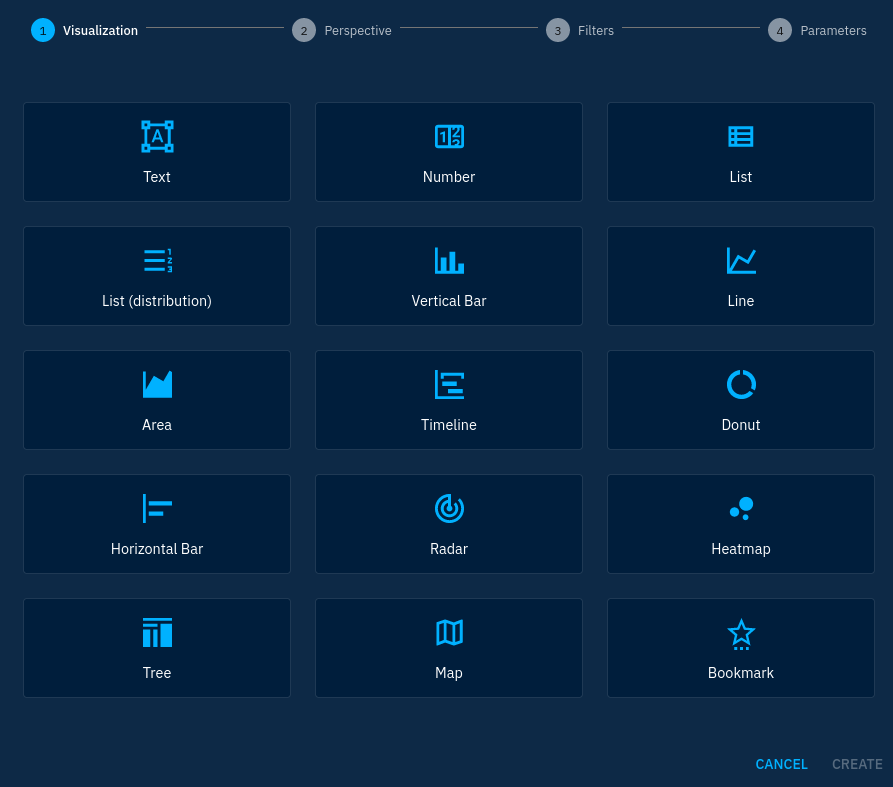
You will first see the pane asking you which kind of widget you want to create. We won't go into the specific of each one, but rather take 2 examples that will give you the main keys. Unfortunately, the Dashboard feature is to my sense the most difficult one to master in OpenCTI and you will need some patience and poking around to fully understand it.
Let's begin with a simple one to have the basics. The number widget allows you to display a sole number which represents the total number of elements your filter will select.
The first thing to do after choosing the widget type is what you want to filter:
- Entities are the actual objects you want to include. It will provide a simple filter that allows you to discriminate entities based on their own fields
- Knowledge Graph provides more complex filters that will allow to make more complex widgets: including objects that have specific relationships notably
- The Activity & History mode won't be covered here but this is an Enterprise feature allowing to create widgets based on the activity of the platform itself
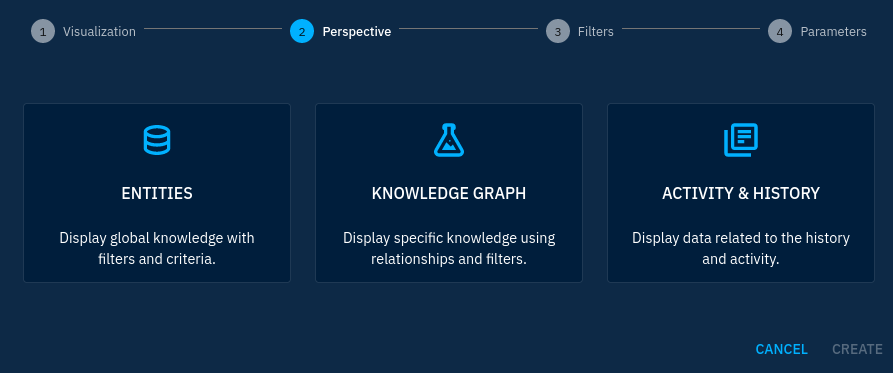
In the case of our simple filter, we will take the Entities mode. It will get us to the next stage which allows actual definition of the filter:
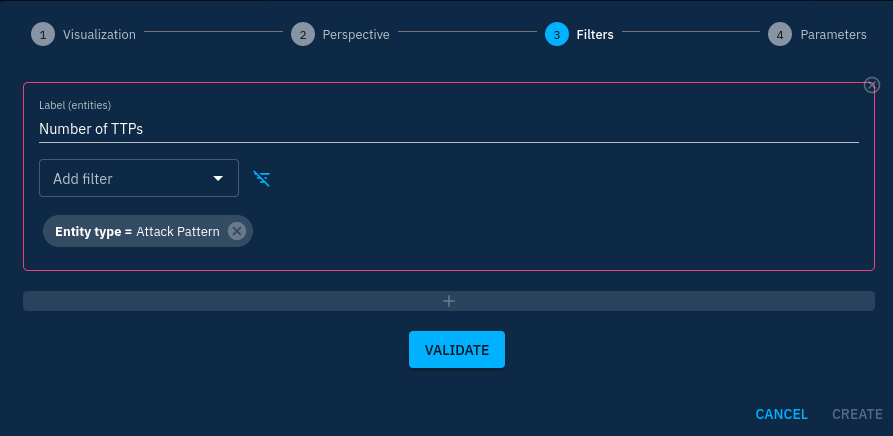
This pane works very similarly as the filters we highlighted before. You can define a label for the series, useful when defining several data series by using the plus button on widgets that allow it. This is not the case here so let's move on to the last stage by clicking the validate button.
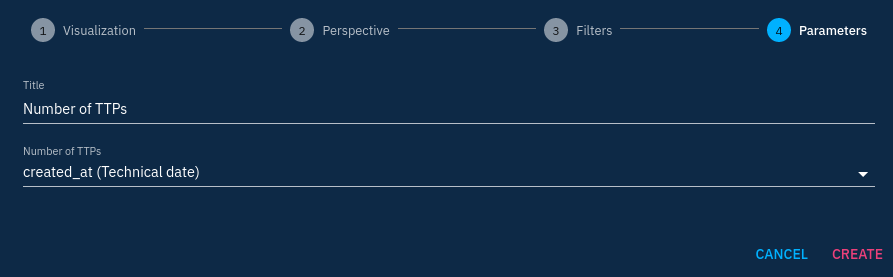
The fields of this pane will allow to input the title of the widget and set the configuration of each series. The most important option here for most widgets is the one that allows you to select which field to take to take into account time (particularly useful to create vertical bars, timelines, and filter by time after creation of the widgets).
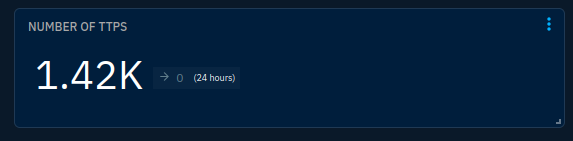
The number widget is quite limited but useful to display recent changes in the platform. Let's create a bit more complex widget.
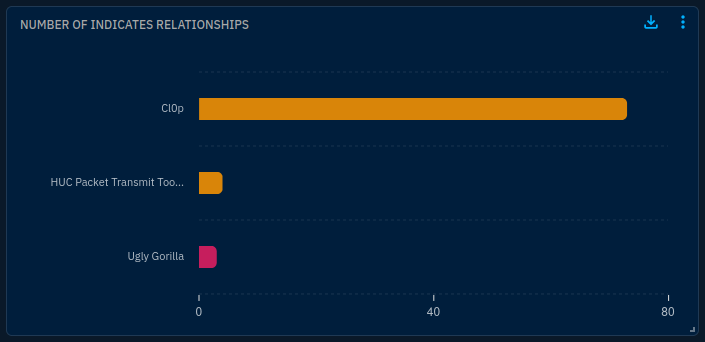
We'll use this time the horizontal bar widget to display the number of indicates relationships by malware, threat actors and intrusion sets.
Given the fact we want to use a filter that takes relationships into accounts, we must use the Graph Knowledge mode. This will take to this pane (filled in for this guide):
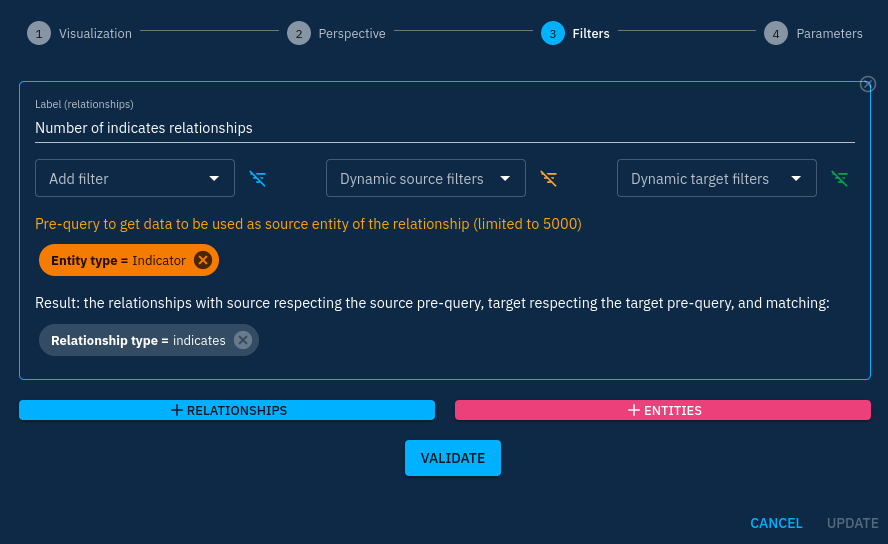
This time we have 3 fields. The first one allows to construct the filter for the objects we want to count in our bar chart. The second and the third ones allow to pre-filter objects by selecting only the source and destination objects we want to see in the graph.
This filter requires a bit more trial-and-error to get familiar with but is powerful to fine-tune every aspect of the widget. You can also add other filters on relationships and entities to add other series.
When validating this filter (by the way, this is a pre-filter on source type indicator and relationship type indicate. Second and first field respectively if you followed), we get to this pane:
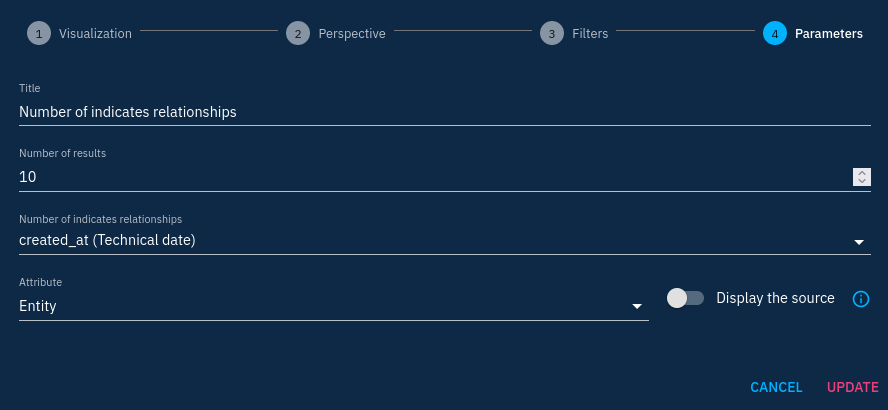
As before, we can add a title and select the field for the time handling. But we can also control the number of objects (i.e. lines here) we will display and the attribute that will be displayed as a label for each bar. For example, in this screenshot, the widget is configured to display the Entity (that is the object name), this will have the effect to display the destination object names and group the bars by them. Thus, we will display the different malware, threat actor and intrusion set entities.
If we click the Display the source button, it will display the sources of relationships rather than the destinations (which is the default).
This is a lot to learn from an article. Again, I recommend you to use this knowledge to poke around in the dashboards configuration.
Last thing, you can restrict your results to a specific time frame by using the top filters on the dashboard pane:

This is where your choice of time to use in the widgets will take the most importance.
Conclusion
This was a dense chapter. I hope you learned some tips and will catch you up with the next post: working with the API.